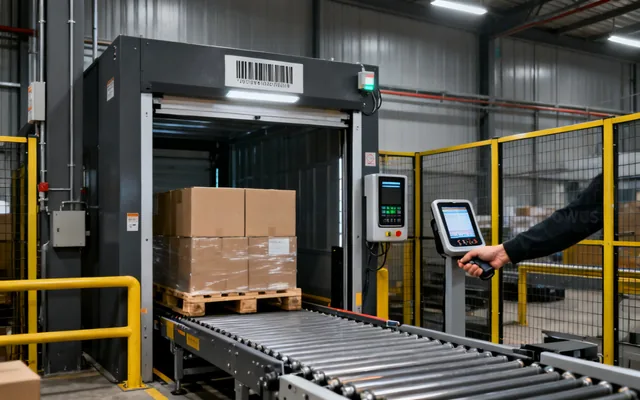
Inbound induction & identity
Capture load unit identity, weight bands and host confirmation before inventory enters storage release logic.
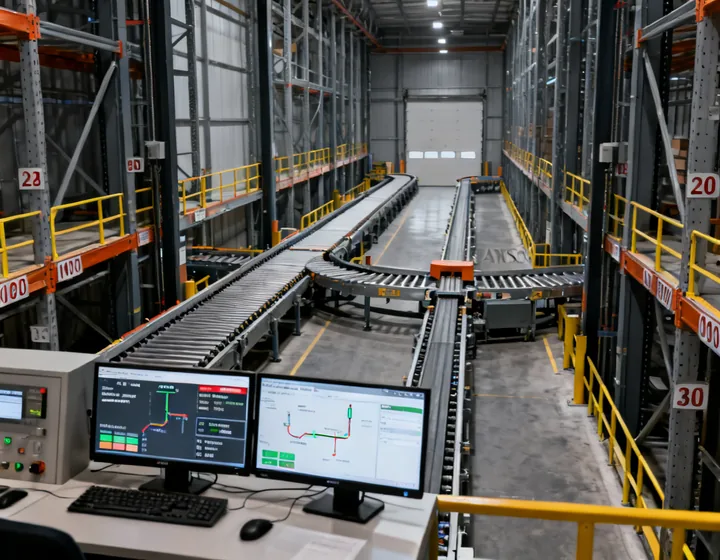
Translate SKU mix, order lines per hour, buffer occupancy and WMS/WCS/PLC ownership into reviewable gates before capital commits. System Logistics keeps evaluation tied to the material-flow path your distribution center actually runs—not brochure rates detached from peak windows and recovery assumptions.
Cards follow Receive, Store, Move, Pick, Sort and Ship—so evaluation stays tied to physical stages rather than abstract technology labels.
Capture load unit identity, weight bands and host confirmation before inventory enters storage release logic.
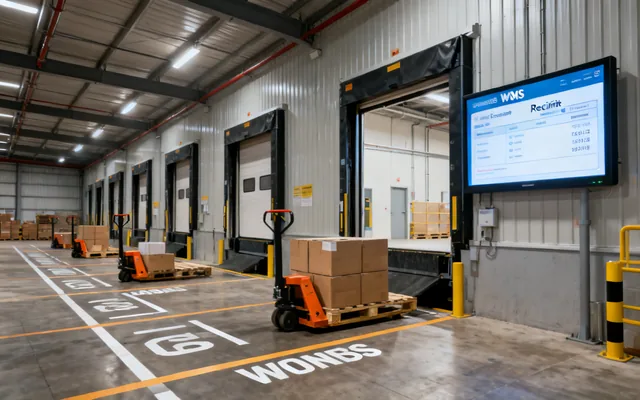
Align ASN exceptions, quarantine holds and release ownership so WMS and WCS do not invent conflicting states.
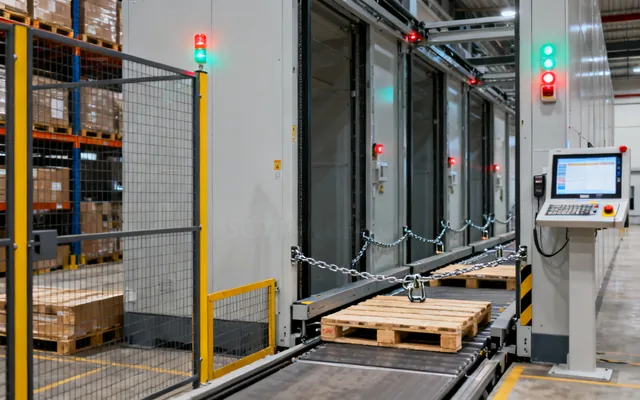
Route suspect loads to hold lanes with explicit timeout and restart ownership before putaway continues.

Coordinate selectivity, inventory cube utilization and fire-access paths under WCS slotting rules.

Balance density gains against recovery isolation when shuttle lanes share a material flow controller.

Keep buffer occupancy visible so goods-to-person waves do not starve or flood pick stations.

Document fleet management system timeouts with PLC and WCS so aisle priority stays recoverable.
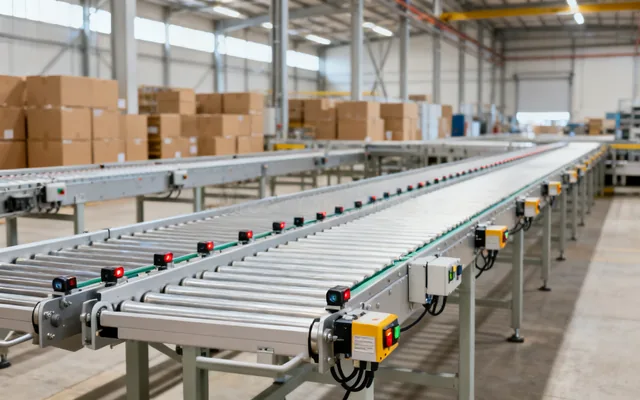
Model zero-pressure accumulation and merge logic against peak factor so bottlenecks stay diagnosable.
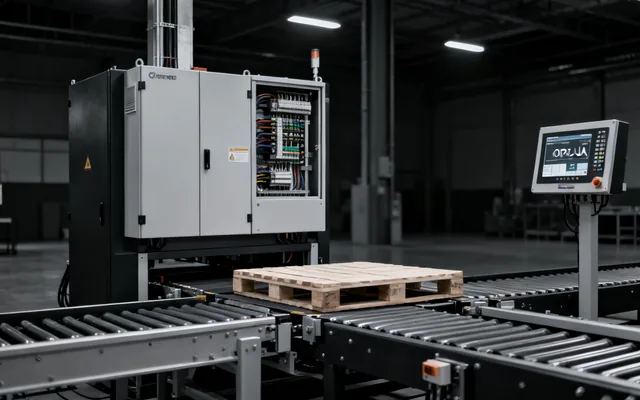
Clarify which layer owns fieldbus or OPC UA bridges when equipment and host clocks disagree.
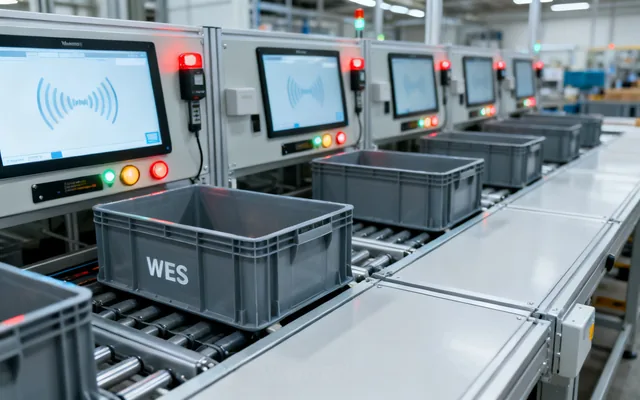
Release waves with pick rate targets that include multi-line share and exception recovery time.
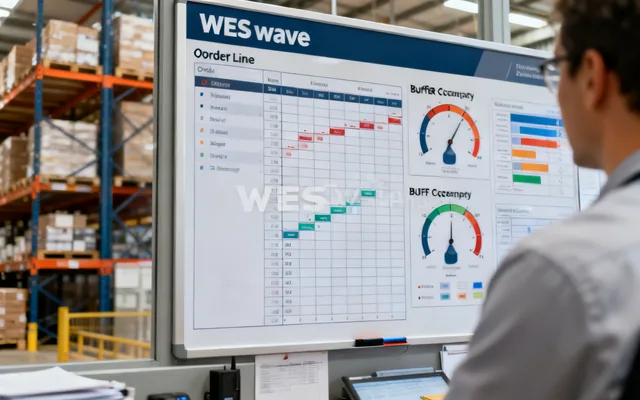
Separate WES optimization from WCS execution so restart ownership remains unambiguous after a fault.
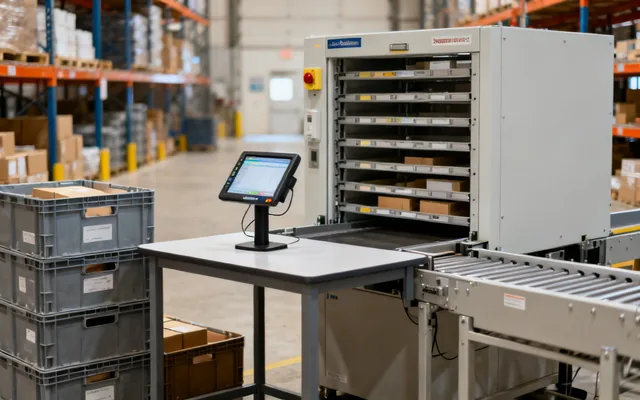
Define who clears short picks, damaged totes and host rejects without freezing the entire pick module.

Validate divert accuracy under peak factor with stated carton size mix and reject recirculation rules.
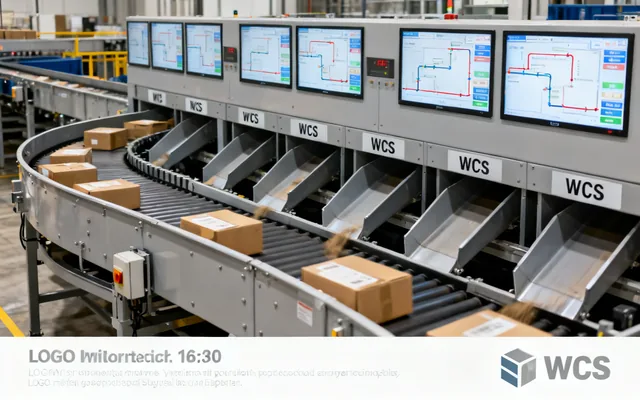
Name the owner for recirculation limits so sortation faults do not silently erode order lines per hour.

Keep palletizing pattern changes under change-control so residual capacity assumptions stay valid.
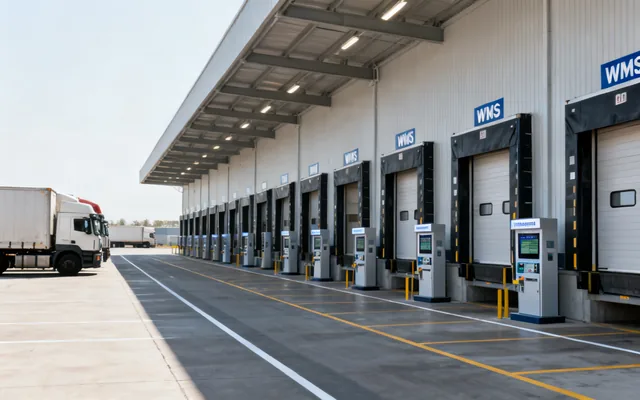
Coordinate trailer appointments with WCS staging so dock congestion does not reverse into sortation.

Close the WMS/WCS ship-confirm loop with timeouts that match carrier cut times and local duty cycle.

Treat dock levelers and restraints as safety inputs that can block release when interlocks are open.
Use the grouped table as a pre-RFQ checklist. Missing peak-window duration or an unnamed PLC owner is more useful than a polished slide that hides the operating boundary.
| Load & order profile | |
|---|---|
| Load unit | Dimensions, weight bands, overhang, pallet/tote/carton type |
| SKU velocity | Active SKU count, ABC classes, seasonal spikes, slotting constraints |
| Order lines / hour | Design rate, multi-line share, wave or waveless release |
| Controls & acceptance | |
| Interface owners | WMS, WCS, WES, PLC, fleet manager, protocols and timeouts |
| Peak window | Peak factor, duration, accumulation, replenishment, exception recovery |
| FAT / SAT evidence | Command/confirm cases, alarm ownership, spares and access routes |
Use the matrix to surface SKU depth, peak factor, temperature and load-unit mix before selecting a controls architecture.
| Vertical | SKU depth | Peak factor | Temperature | Pallet / tote mix |
|---|---|---|---|---|
| E-commerce DC | High active SKU depth | 1.8–3.0× design day | Ambient | Tote-heavy, carton outbound |
| Grocery | Medium–high freshness SKUs | 1.4–2.2× promo windows | Ambient + chilled | Pallet + case + tote |
| Cold chain | Controlled SKU sets | 1.3–2.0× with door cycles | Chilled / frozen | Pallet dominant |
| Manufacturing | BOM-driven WIP SKUs | Shift-tied peaks | Ambient / process | Pallet & tote staging |
| Multi-client campus | Variable by contract | Client-calendar spikes | Mixed zones | Mixed load units |
High SKU depth, 1.8–3.0× peak factor, ambient tote-heavy flows.
Promo-driven peaks with ambient and chilled case/tote mixes.
Door-cycle sensitive peaks with pallet-dominant frozen lanes.
Shift-tied peaks for BOM-driven WIP pallet and tote staging.
Contract-variable SKU depth and mixed load-unit calendars.
Share load units, SKU/order profile, peak rate, interfaces and site constraints so the response addresses operating evidence—not a generic brochure pack.