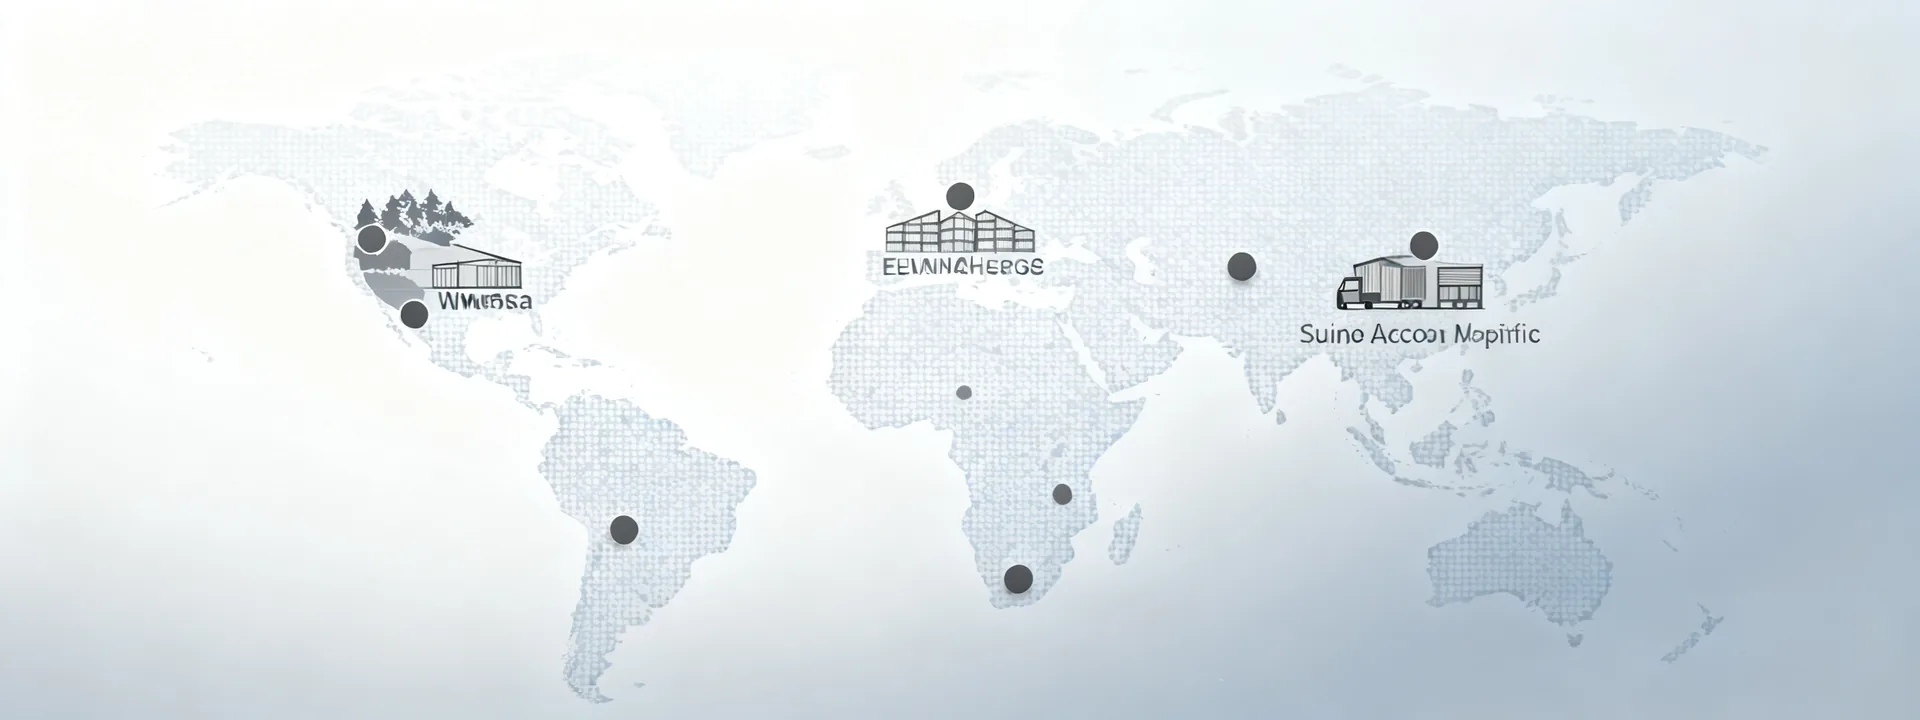
Stylized map of warehouse project regions for System Logistics
Industries by operating geography

System Logistics industries mapped by warehouse operating profile

Compare e-commerce, grocery, cold chain, manufacturing and multi-client campus flows using SKU depth, peak factor, temperature and load-unit mix—not generic industry slogans. Regional tabs organize the same operating questions by typical dock calendars and host maturity.

Regional tabs

Same controls questions, different calendars

System Logistics uses region tabs to highlight how peak windows, temperature zones and host interfaces typically differ. Exact site data still overrides regional defaults.

North America operating notes

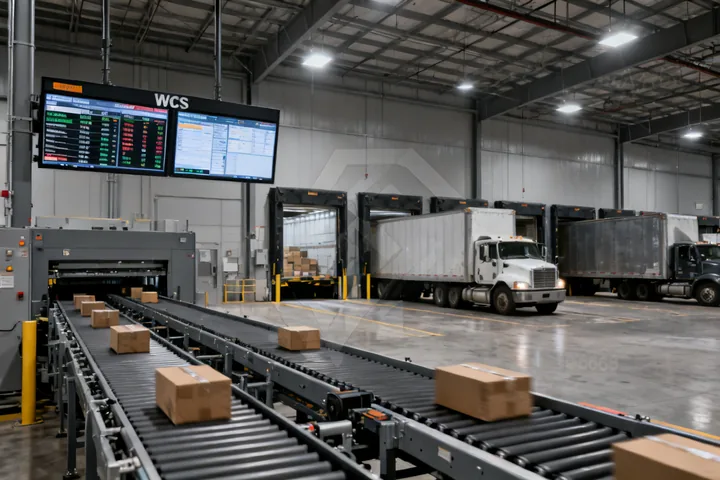
Large e-commerce DCs often pair high SKU depth with 1.8–3.0× promotional peaks and tote-heavy goods-to-person modules. Grocery networks add chilled case flow and trailer appointment pressure at the dock. System Logistics intake asks which WMS instance owns ship-confirm when a multi-client campus shares sortation. Trailer cut times must align with WCS staging release, or outbound congestion reverses into divert recirculation.

  • Trailer cut times vs WCS staging release
  • Brownfield aisle width and floor quality constraints
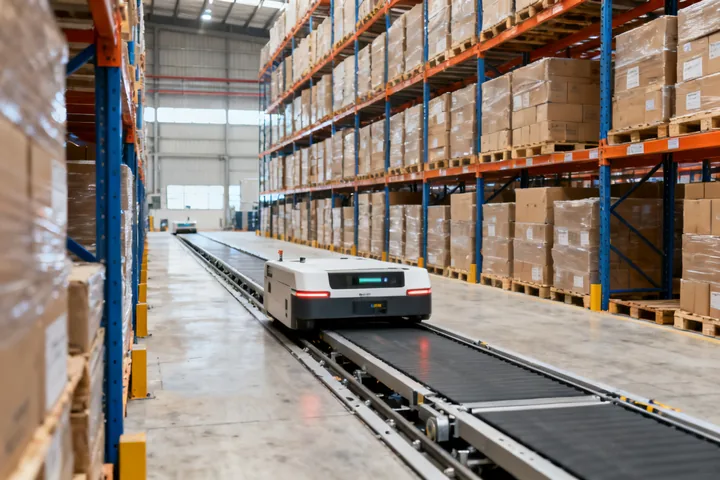
  • AMR coexistence with forklift residual capacity rules
North America distribution center with sortation and docks
Selection trade-offs

System Logistics surfaces opposing views before architecture freeze

These disputes are evaluation aids, not product slogans. Record which side your site data actually supports before locking AS/RS, sorter or AGV/AMR scope.

Fixed automation vs flexible robotics

Fixed automation: Higher deterministic capacity and mature controls when SKU velocity and order lines per hour stay stable across the peak window.

Flexible robotics: Faster phasing and layout adaptation when demand volatility outruns conveyor redesign cycles. System Logistics requires duty-cycle, aisle width and SLAM navigation constraints before preferring either path.

Storage density vs direct access

Maximum density: Improves inventory cube utilization and footprint when profiles suit shuttle or cube storage.

Direct selectivity: Improves maintenance isolation, fire-access flexibility and recovery when SKU churn is high. Density gains that erase recovery routes are treated as incomplete operating concepts.

Centralized WCS/WES vs modular controls

Centralized control: One operational view and coordinated global optimization across divert accuracy, merge logic and buffer occupancy.

Modular orchestration: Isolates failures and reduces single-vendor dependency, at the cost of more interface cycle-time ownership work across PLC islands.

Peak rate vs operational resilience

Peak throughput: Prioritizes maximum output under a defined design day and peak factor.

Resilient flow: Prioritizes accumulation, redundancy and graceful degradation when exceptions hit. System Logistics will not accept a peak-minute screenshot as SAT evidence without recovery objectives.

Profile intensity bars

Relative planning intensity by vertical

Bars are qualitative planning aids for discussion, not measured benchmarks for a named customer site. Use them to prioritize which inputs System Logistics must collect earliest.

E-commerce SKU depthHigh
Grocery peak factor sensitivityHigh
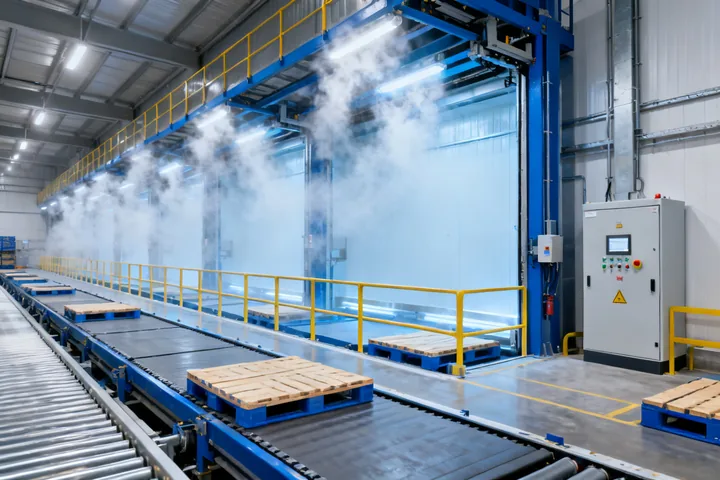
Cold chain door-cycle impactHigh
Manufacturing shift couplingMedium
Multi-client interface varianceHigh
Industry intake

Tell System Logistics which vertical drives the peak

Share the operating profile, temperature zones and host owners so engineering can attach rate and interface questions to the correct calendar. The compact form keeps the same backend fields as other System Logistics inquiry surfaces.

  • Vertical and temperature zones
  • SKU depth and peak factor estimate
  • WMS / WCS / PLC owners
Please provide your name.
Please provide a valid email.
Please provide your company.
Please describe the application.
Consent is required to submit.